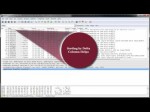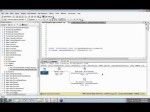
www.riverbed.com Hansang Bae provides some hands on tips for Wireshark, the world’s foremost network protocol analyzer. In the session, you will learn how to add additional columns such as Delta Time, how to add different Profiles, and how to sort the columns to coax the information from the trace files. Updated Description: Hansang Bae provides some hands-on tips for getting acclimated with Wireshark, the world’s foremost network protocol analyzer. In this session, you will learn how to add additional columns such as Delta Time, how to add different Profiles, and how to sort the columns to coax information more easily from the trace files. Training your eye to pick up on deltas or any abnormalities is the first step in identifying the root cause and troubleshooting problems. As an enhancement to Wireshark, Cascade Pilot™ Personal Edition is a visually rich and powerful analyzer for wired and wireless networks that is fully integrated with Wireshark, the leading open-source network protocol analyzer. The visual selection and drill-down features of Cascade Pilot enable users to quickly sift through terabytes of packets to readily quantify traffic content and send to Wireshark for deep packet inspection. Cascade Pilot Personal Edition capitalizes on your existing expertise with Wireshark while dramatically increasing efficiency in identifying and diagnosing network problems. For more information about Riverbed Cascade, visit:www.riverbed.com


